For the first design, I modified the original 4 band schematic to 8 bands, and the simulation works with this modification very fast, the required time is same as like with 1 filter only (while several software running on the background). The schematic simplified, I removed virtual batteries, used VCC/VEE power sources instead. Deleted the on/off switch which is really needless. This simplified schematic without virtual instruments working well for AC analysis.
First of all, I need math expression (again :) for getting frequency values between 20 Hz and 20 kHz for 8 bands. I think about 10 bands, but for parametric EQ where the middle frequency and the Q are adjustable, I think 10 bands are too much. The parametric EQ of URS software have 5 bands only. The first solution to get middle values between the lowest and highest band I found on the NET by this page. This webpage counts the geometric mean between f1 and f2, which are the lowest and highest frequencies on the system.

This solution is not the best for 8 bands, because first I can get the middle of the lowest and highest value which are 3 bands, but after, I have to get all middles between these 3 values, finally I have 5 or 9 results instead of 8. Maybe the possible solution if the highest frequency is around 40 kHz, get 9 results with this page, and delete the last (40 kHz) value. So you can have 8 results, where the highest around 20 kHz.
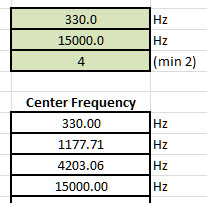
The really tricksy solution is the Excel spreadsheet. This table is not my own work, I got help from Frank Walker. I just enter the start and end values to this spreadsheet, and the required numbers between these values, and the table getting back the solutions.
First, compare the result of this expression with the original 4 band UREI EQ:
 |  |

Tables for more than 4 bands:
 |  |  |
 |  |
=IF(C8<$D$5,$D$3*10^((LOG10($D$4)-LOG10($D$3))*(C8-1)/($D$5-1)), IF(C8=$D$5,$D$4,IF(C8>$D$5," ","?")))
This expression counts the required frequencies between the lowest and highest bands. The lowest frequency is on the cell no. D3, the highest on D4, the number of bands is on the D5. The column C is the serial number of bands from 1 to 8.
More than 8 channels have problem with Q, what must be very high if the number of bands are too much. If less than 8 band required, all channels have bypass switch and the Q parameter can be set to lower.
For the current design, I need the table of 8 bands EQ. The range of frequency adjustment must be smaller than with 4 bands only, modifications of the schematic required:

The important aspect, that we have to work with standard values of capacitors and potentiometers. The first modification requires for possible higher Q value, and less possible range of the adjustment of Q:
- R2 120 Ohm instead of 390 Ohm
- R3 1.5 KOhm instead of 390 Ohm
The second modification is for the less range of frequency adjustment.
- R5 and R7 potentiometers changed from 55 KOhm to 22 KOhm.
After these changes, on the filters have to be modified the C1 and C2 capacitors only:
- 330 nF
- 150 nF
- 68 nF
- 33 nF
- 15 nF
- 7.5 nF
- 3.6 nF
- C1 = 1.8 nF, C2 = 1.6 nF
Possible to fine tune the required frequency, if the values of C1 and C2 are not same. With this method, the required frequency can be fine shifted to lower or higher value, and can be re-tuned the value of Q.
After analyzing the first band I started to define the second, but before, I wonder how about these bands on the original 4 band EQ:
This is the result of analysis for all 4 bands, with possible lowest, middle, and the possible highest frequencies.
Finally, the graph of AC analysis of 1st, 2nd, and 3rd frequencies not succeed pretty like on the original UREI EQ, because with available standard values this is not possible:
These graphs are not really pretty, but this is no problem, because the parameters are adjustable, and the graph cannot visible during operation :).
The next step is the AC analysis of all 8 bands:
The graphs are really not nice like the original one :(.
With the next analysis I reduced the Q from 100% to 70% on all bands:
This analysis would be more interested, if I bypass some filters, or changing the cut/boost parameter too.
Finally I tried to correct the "errors" of the graph. I reduced the bands frequency to 93...95% from 100, this is the thinner red line. The new line is closer to the green, which is the possible lowest frequencies of all 8 bands:
For this equalizer I have PCB for 4 and 6 bands only, but my next PCB project is the expandable modular parametric equalizer from 4 bands to any.
See also:
- Simulation of UREI LP/HP filter module
- Modular, expandable parametric equalizer based on UREI546
- Simulation and software analysis of UREI 546
- UREI546 parametric EQ like URS VST EQ bundle
- 6 and 10 bands for UREI 546 parametric equalizer
- Math expression for UREI546 parametric EQ design
- Parametric EQ Project - Modular UREI545 and 546
- Modular equalizer with gyrator filter
- PDF manual of modular gyrator EQ
- PDF manual of UREI 545 and 546 EQ clone
| ||||||||||||||||||||||||||||||||||||||||||||||||||||||


No comments:
Post a Comment